How to debug in Kratos
Debug hardware as software
One major feature of Kratos is to allow designers debug their hardware designers in a fashion close to debugging software. Kratos has a suite of tools to support a wide-range of SystemVerilog simulators such as Verilator and ncsim.
Here is a demonstration of debugging a design written in Kratos:
To see more details, please visit kratos-vscode and kratos-runtime
Which line generates this SystemVerilog?
kratos comes with a GUI to help you debug the system verilog it
generated. You need to install kratos-debug to use the tool:
pip install kratos-debug
Once installed, you can do
kratos-debug [src.sv]
It will launch a window as the one below:
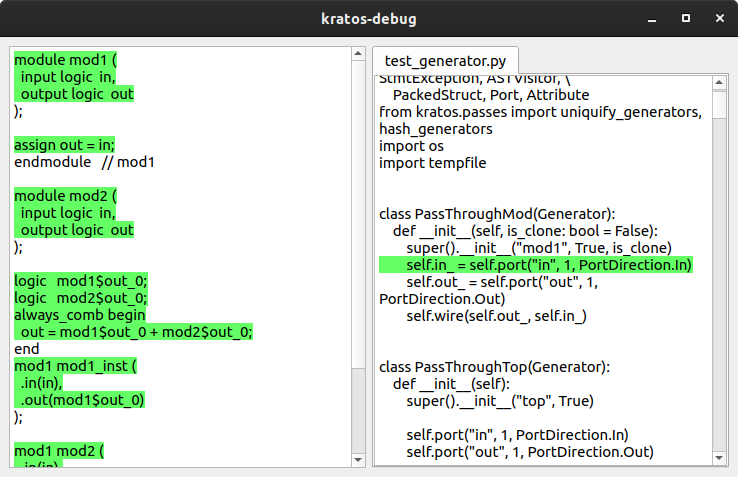
The left panel shows the generated verilog. You can click on any line that’s highlighted and the right panel will show you the source code that’s responsible for that particular line.
Note
To use this feature, you have to set debug=True when initializing
the Generator.__init__(). In addition, you also need to
use verilog(mod, debug=True, filename=[src.sv]) when generating
the verilog, where mod is the top generator, and [src.sv]
is the target system source file. The function will also produce
[src.sv.].debug in the same directory as [src.sv]. You
need that file for kratos-debug.
You can slo turn the debug mode on on a global scale. You can think
global debug as -g in C/C++ compilers.
To do so, simply do
kratos.generator.set_global_debug(True)
Commenting SystemVerilog
Kratos provides a way to let users comment on on high-level constructs
that will be turned into SystemVerilog comments. In most cases, you can
call kratos.comment(node, comment_str) to comment any IR node.
In some helper functions where obtaining the node is impossible, these
helper functions typically have optional arguments called comemnt_str
that can help you to comment things.
Note
Notice that not all the node being commented will appear in SystemVerilog right now. We are actively working on refactoring codebase to completely support this feature.